RMA Valuation Edition
RMA Valuation Edition makes your industry comparisons more useful, credible and defendable
ValuSource worked closely with RMA to develop the Annual Statement Studies Valuation Edition. In addition to the data contained in our standard RMA Annual Statement Studies database, the Valuation Edition contains enhanced financial ratios, including national and regional data, the entire distribution curve for every variable, an income statement and balance sheet presented in dollars ($) as well as in percentages (%), and industry growth rates. No other source of financial comparison data provides the entire distribution curve.
If you have not seen the Valuation Edition data, you’ll be impressed with how the additional data can help you provide more useful, credible, and defendable financial statement benchmarks.
Accessing RMA Valuation Edition
If you are a ValuSource Software user, you can download RMA Valuation Edition data directly into your valuation projects. And if you’re using Excel, you can download the data directly into Excel. For Excel, we provide an Excel-based analyzer that allows you to perform a ranking analysis on a target company. Ranking is a much more precise why of benchmarking, that provides a much clearer picture of how the company compares to the industry. ValuSource valuation projects have RMA ranking analysis built-in.
Navigating RMA Data
Use the search bar at the top to find the industry and specific slice of data that you need. You can select either a single year or multiple years. Multiple years are great for seeing trends. For example, what’s gross profit doing over time in an Industry?
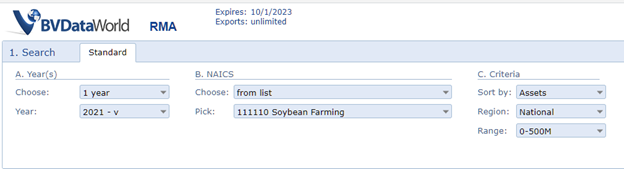
To view or download the data, you start by selecting a NAICS code. You have the choice of selecting from a list of NAICS codes or searching the list for specific text that you enter. RMA data is broken down by Asset, Sales or historical data, region, and size range.
What Makes RMA Valuation Edition so Different?
You’ll notice that RMA displays the 10th to the 90th decile for every variable in RMA, including ratios and common-size income statement and balance sheet. This is where the real power of the RMA Valuation Edition comes in. By providing this additional data, you can get a much clearer picture of how the industry is performing, from the worst performers to the best. And because decile is available, you can rank your company instead of just showing how much your company differs from the industry median or average.
Understanding Deciles
Here is a simple analogy to explain how deciles work. When a student takes a college preparatory exam like the ACT or the SAT, the test score includes a percentile ranking. Everyone knows what that means. If you’re in the 98th percentile, 97% of the people who took the test, scored less than you did. RMA decile data works exactly the same way. If a company is the 50th percentile, it means 49% of the companies that responded had a value that was less you’re your company’s. So not only does this make your benchmarking more precise, but it’s also much easier to explain.
Why Rank a Company Rather than Using Standard Benchmarking Approach?
As an example, instead of saying your target company’s Operating Profit is 2% above industry average, you can say the target company is ranked at the 70 percentile. This means 69% of the companies had an Operating Profit that was less than the target company. This ranking idea applies to every variable contained in the RMA ratios and common-size income statement and balance sheet.
In reviewing the complete financial statement ranking report, you can easily see (and defend) how the company’s financial performance impacts both ongoing cash flow and risk. And this level of benchmarking clarity adds credibility to your valuation reports.
Since RMA Valuation Edition is the only source of financial statement benchmarking data that contains decile data, performing a ranking analysis is not possible with other sources. Traditional benchmarking is more like a green-light, yellow-light, red-light approach, where your target company is either above the industry, at the industry, or below the industry. Having the additional data to perform a ranking analysis allows you to paint a much clearer picture and tell a more compelling story of how your company compares to the industry.
Click here to learn more about RMA data.