Beginning with the 2026 edition, ProSight’s Annual Statement Studies will include a category for businesses with $250 million and over in assets. “Folks have been asking for this,” says Jorge Mera, ProSight product manager, “and we’ve been compiling the information for years.”
Mera says the biggest impact of the expansion is the increased sample size. “We usually have 150,000 to 200,000 financial statements in our sample, and this will add approximately 20,000 statements.” The expanded sample will provide additional data to support the new asset-size segment and enhance the overall breadth of the Statement Studies data.
In addition, the new data will likely be reflected in the maximum sales column. For example, companies with $250 million and over in assets could have sales that place them in the $25 million and over sales segment. As a result, users may see changes in that sales segment that are driven by the addition of the new asset size segment.
“I think that’s something users will need to understand when looking specifically at the maximum sales column,” Mera says, “and especially when comparing that column with prior years or with other segment sizes within the sales category.”
In the ValuSource ProSight database, the new $250M+ category can be accessed through the Sort by Assets selection. You’ll see the $250M+ category listed directly below $100M–$250M.

The aggregate historical data affected by the addition of companies with $250M+ in assets can be found in the Historical Data view. Because these columns include data from companies of all sizes, they will also reflect the newly added $250M+ companies.
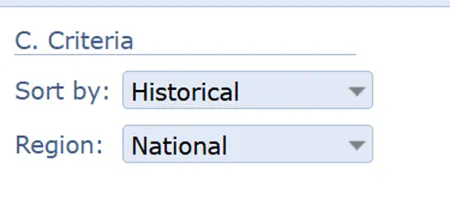
To view the historic data, select the sort by Historical.
When the new ProSight data is released, the current year will include the new $250M+ companies, while prior years will remain unchanged. Going forward, each new annual release will add another year of historical data that includes the $250M+ companies. After the first year, one historical year will include them; after the second year, two years will include them, and so on.
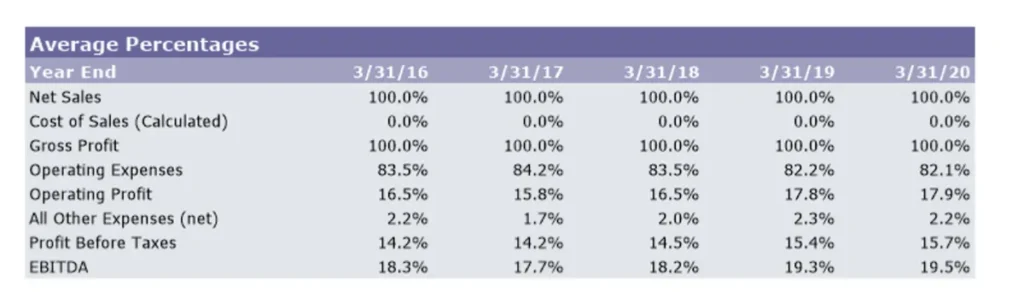
Below is an example of the historical income statement data view for 2016-2020.